 Catalogue PIGMA
Barents Sea
Type of resources
Available actions
Topics
Keywords
Contact for the resource
Provided by
Years
Formats
Representation types
Update frequencies
Scale
Resolution
-
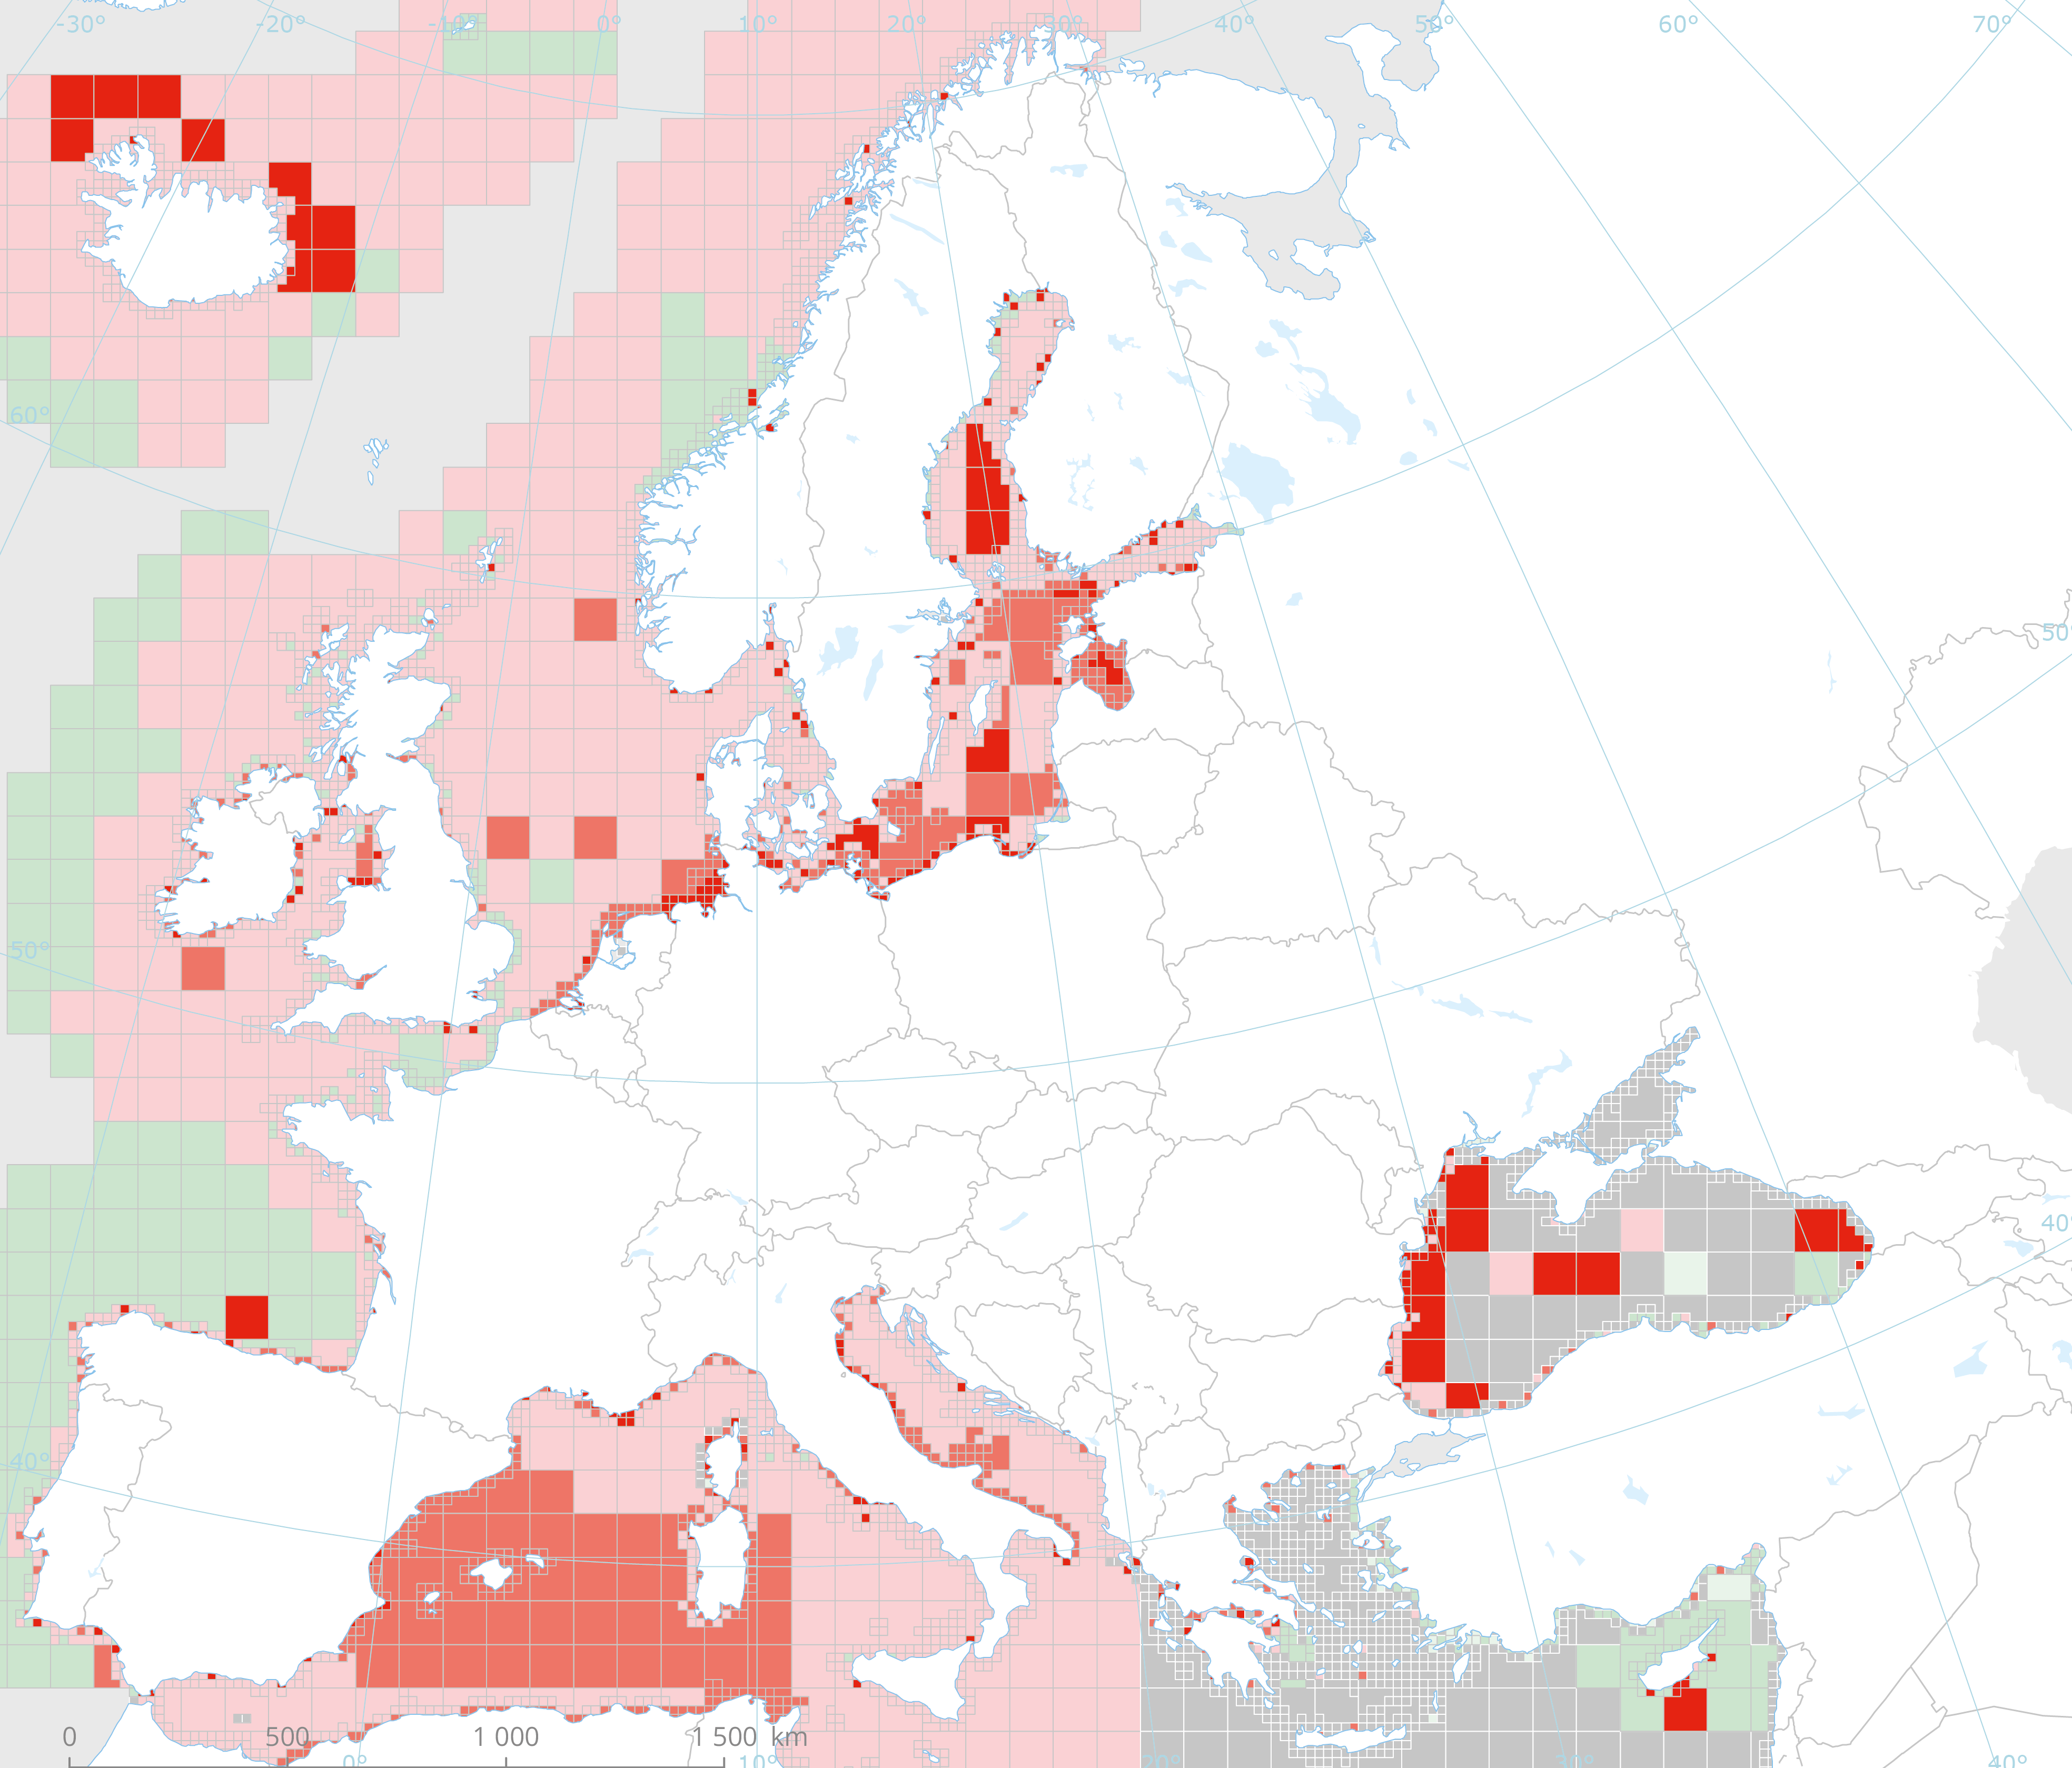
This dataset presents the resulting assessment grid (based on the EEA reference grid) with the classification of ecosystem health of the transitional, coastal and marine waters in the context of the Water Framework Directive (WFD) and the Marine Strategy Framework Directive (MSFD). This classification has been performed using the MESH+ (Marine EcoSystem Health) tool. The MESH+ tool builds on the EEA assessment tools developed and applied in the context of assessing the degree of contamination (CHASE+), eutrophication (HEAT+) and biodiversity (BEAT+) in Europe's seas (EEA, 2018a, 2019c; Vaughan et al., 2019). MESH+ makes use of the same data sets and threshold values used in these assessments but recombines these in a new framework that addresses 'ecosystem condition'. The overall area of interest used is based on the marine regions and subregions under the MSFD. Additionally, Norwegian (Barents Sea and Norwegian Sea) and Icelandic waters (’Iceland Sea’) have been added (see Surrounding seas of Europe). Note that within the North East Atlantic region only the subregions within EEZ boundaries (~200 nm) have been included. The spatial resolution of the assessment grid is 20 km x 20 km in coastal areas and 100 km x 100 km in offshore areas. This dataset underpins the findings and cartographic representations published in the report "Marine Messages II" (EEA, 2020): https://www.eea.europa.eu/publications/marine-messages-2
-
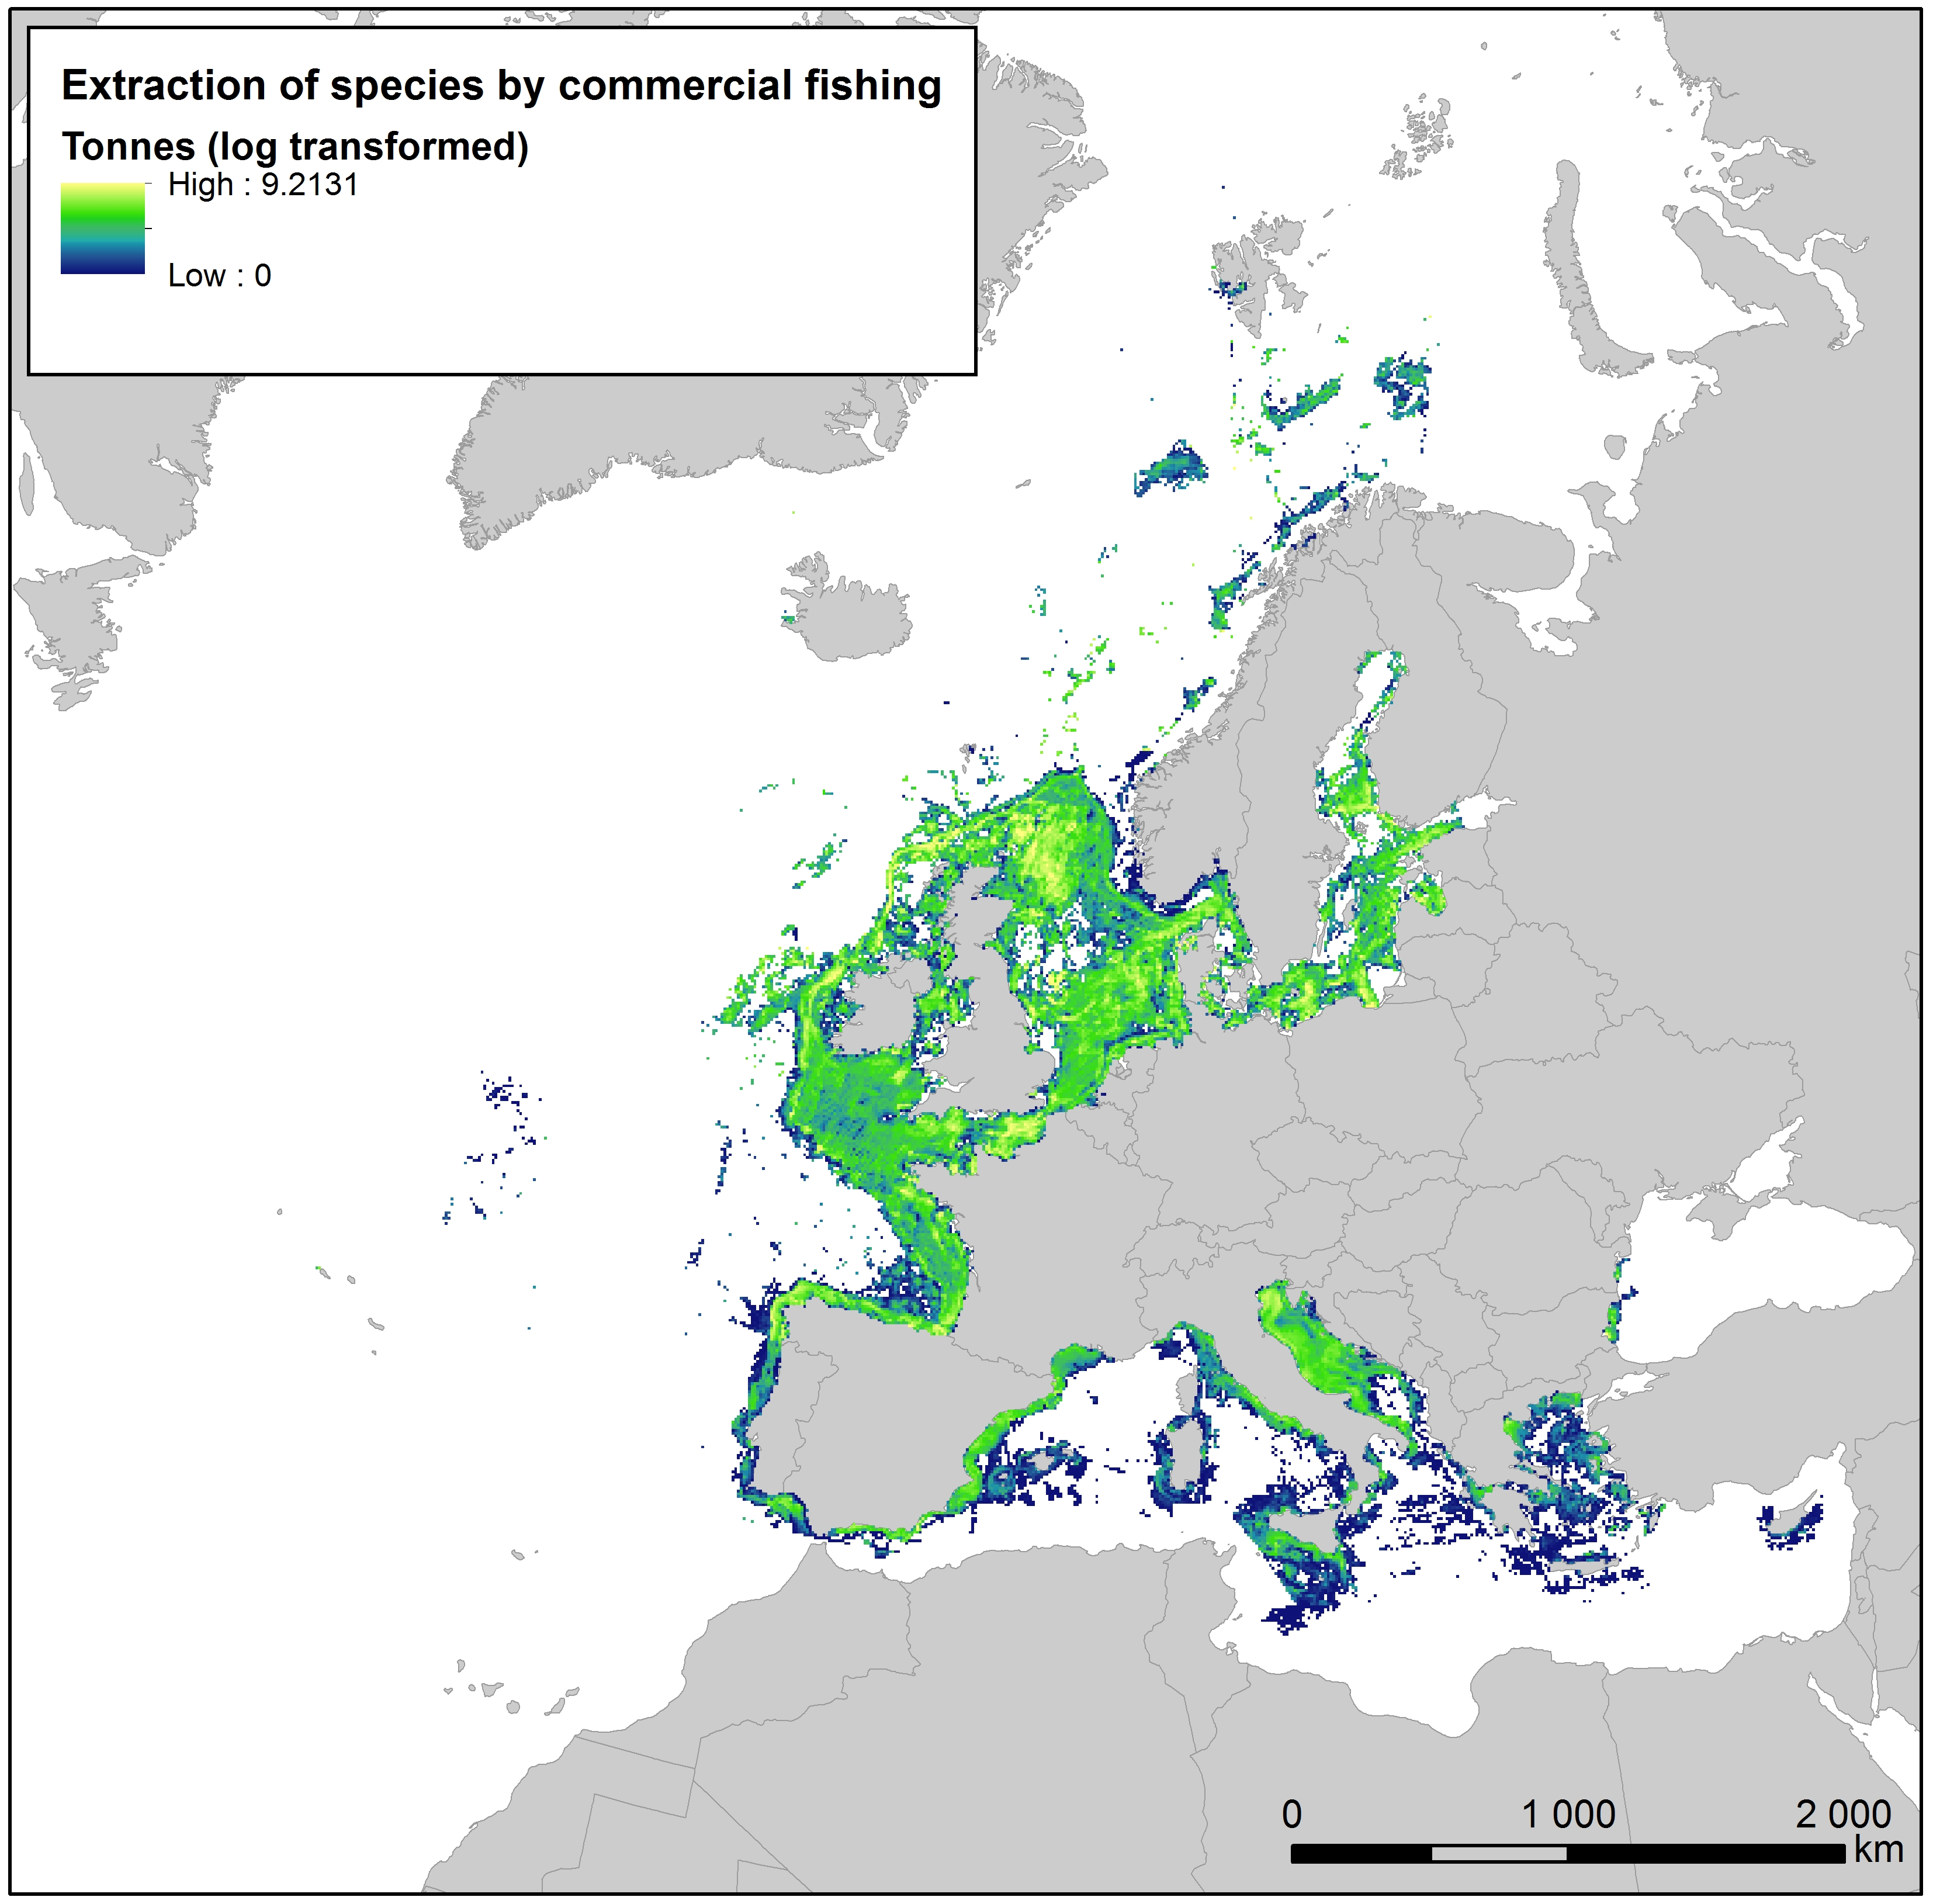
This raster dataset provides the estimation of the extracted tonnes of fish by commercial fishing per 10 km grid cell in the European seas. The dataset has been derived from the combination of demersal and pelagic fishing data, together with fish landings data (2011-2016) from the European Commission’s Joint Research Centre - Independent experts of the Scientific, Technical and Economic Committee for Fisheries (JRC STECF). The temporal extent varies between the data sources. The cell values have been transformed to a logarithmic scale (ln1). This dataset has been prepared for the calculation of the combined effect index, produced for the ETC/ICM Report 4/2019 "Multiple pressures and their combined effects in Europe's seas" available on: https://www.eionet.europa.eu/etcs/etc-icm/etc-icm-report-4-2019-multiple-pressures-and-their-combined-effects-in-europes-seas-1.
-
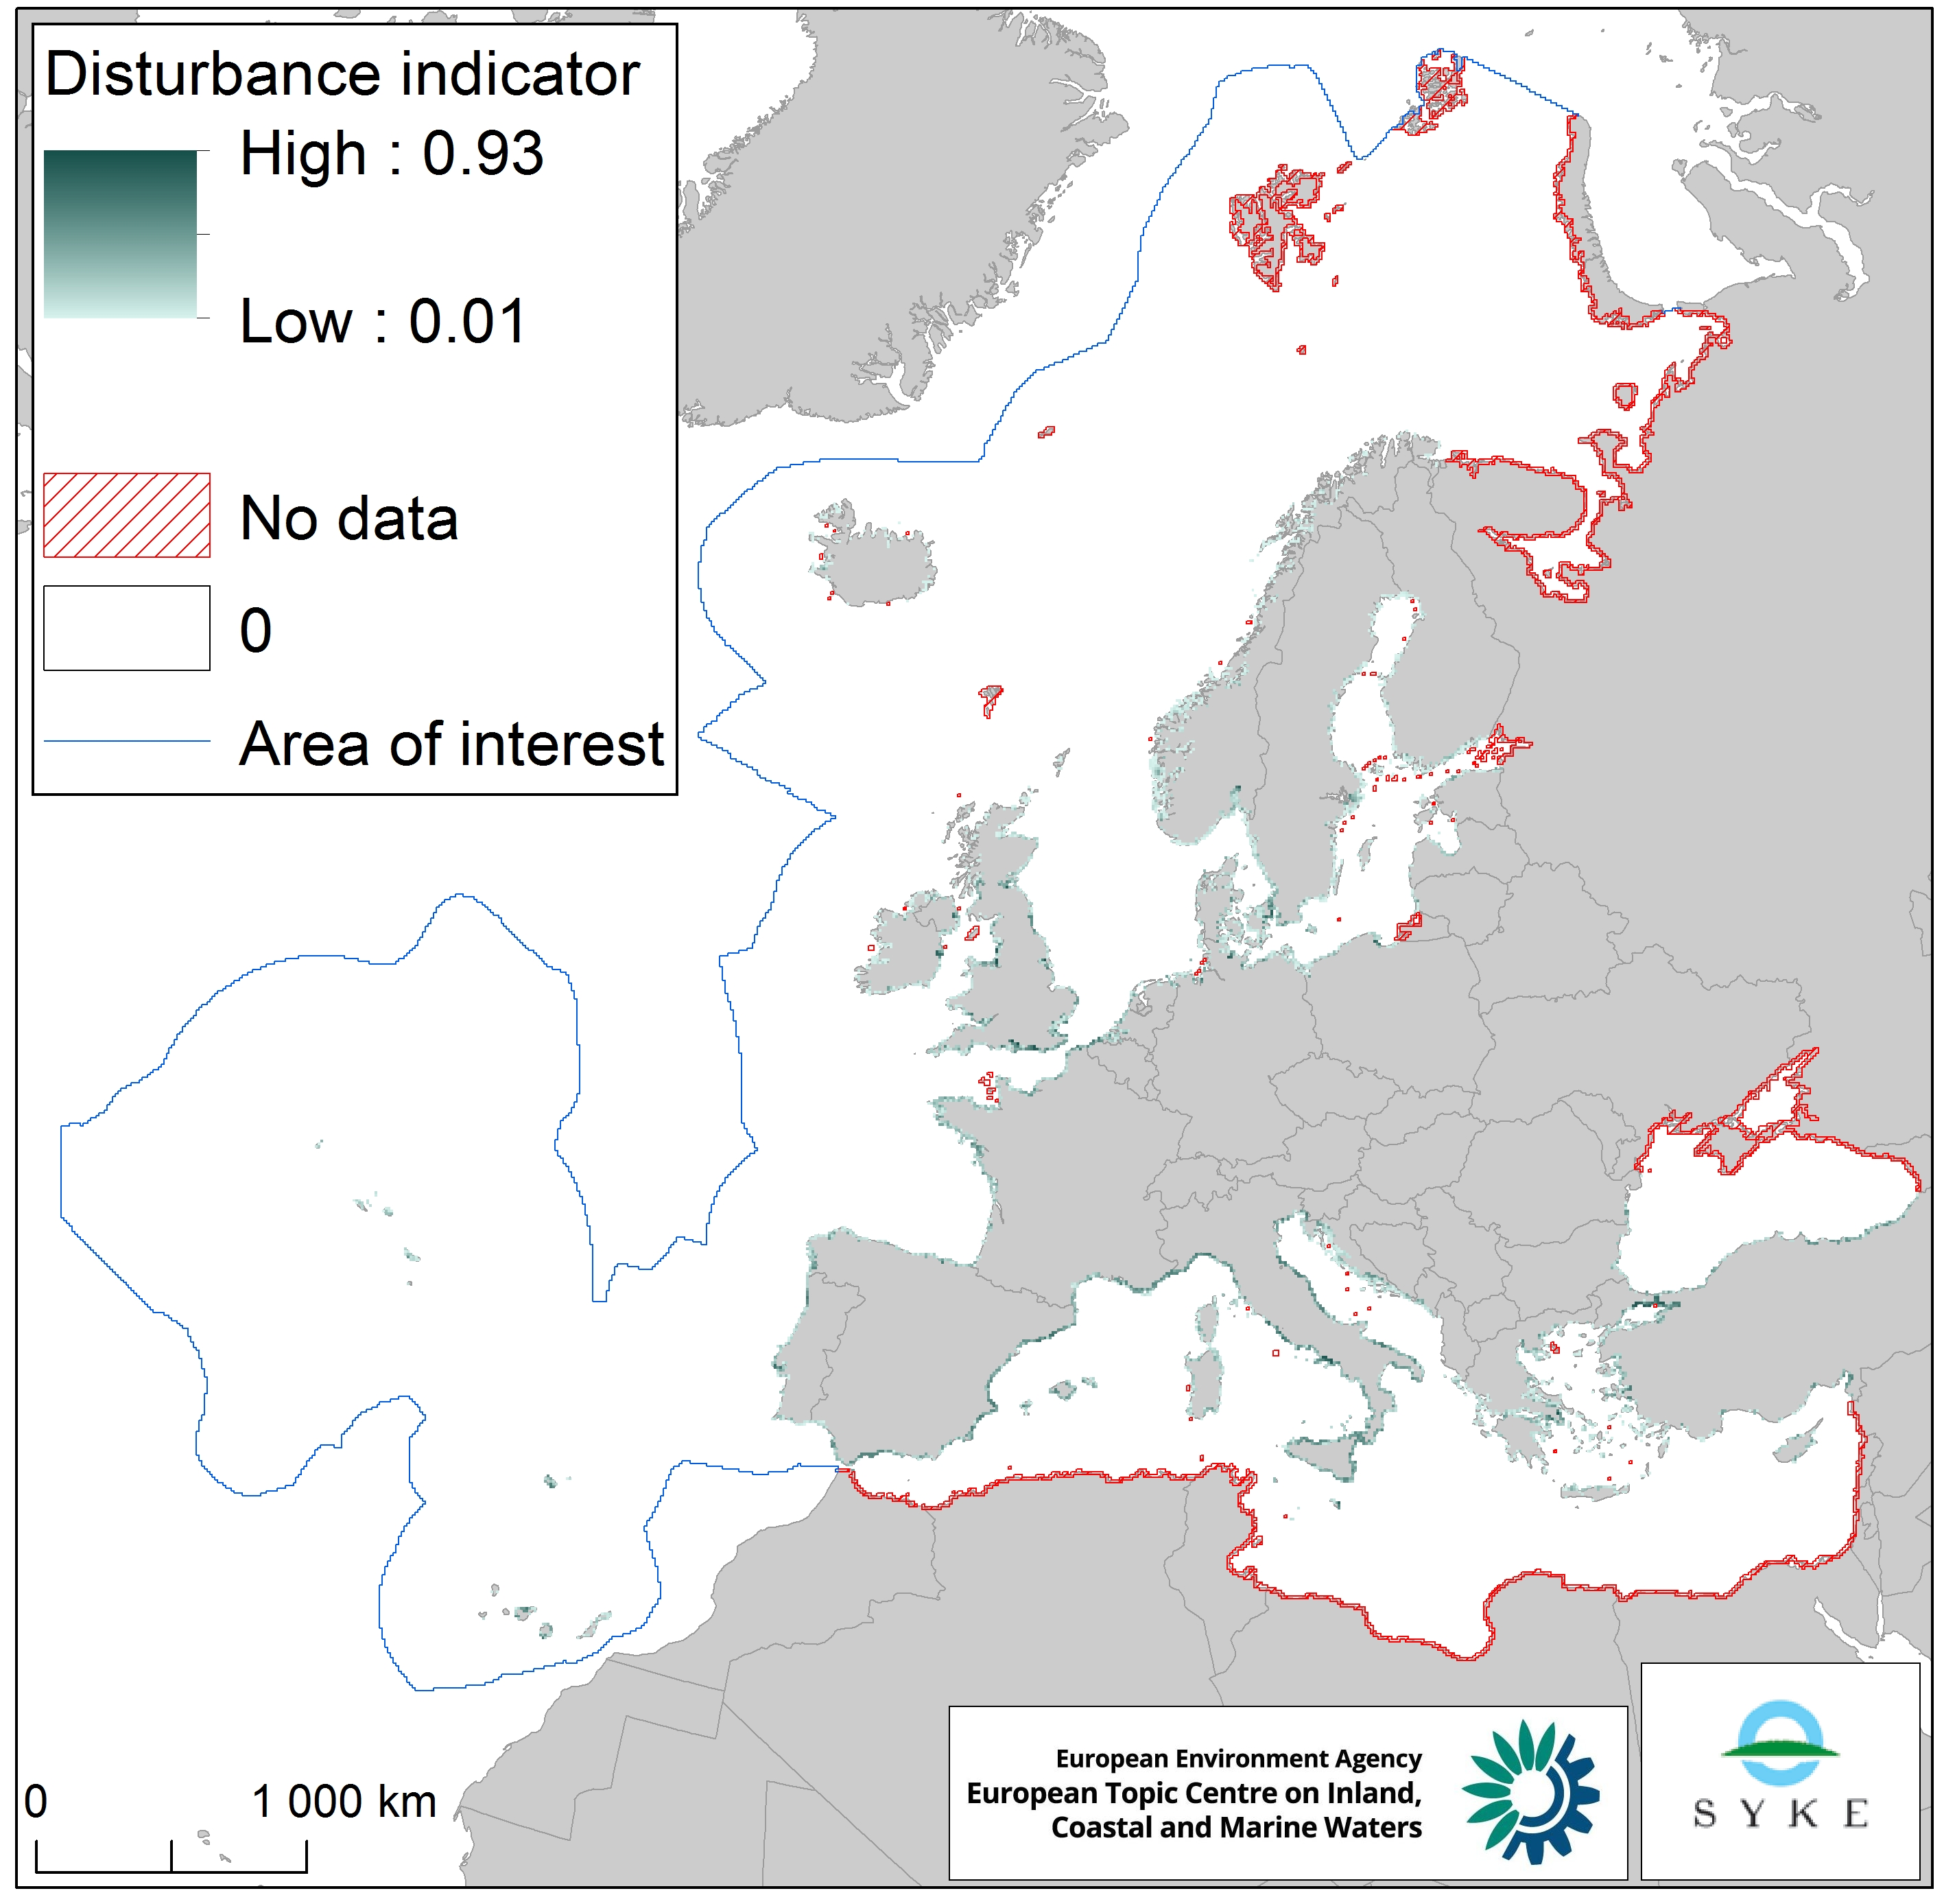
The raster dataset represents the intensity of species disturbance due to human presence along European coastlines. The dataset was created by combining the coastal urbanisation layer derived from Corine Land Cover 2012 (with the percentage of urbanised coastline per EEA 10 km grid cell) and the population density layer based on EUROSTAT NUTS 2016 data (with the population density in the NUTS 3 region corresponding to the coastal EEA 10 km grid cell). The dataset does not cover southern and western Mediterranean Sea, northern Black Sea and northernmost Atlantic Ocean. The dataset was prepared for the combined effect index produced for the ETC/ICM Report 4/2019 "Multiple pressures and their combined effects in Europe's seas" available on: https://www.eionet.europa.eu/etcs/etc-icm/etc-icm-report-4-2019-multiple-pressures-and-their-combined-effects-in-europes-seas-1.
-
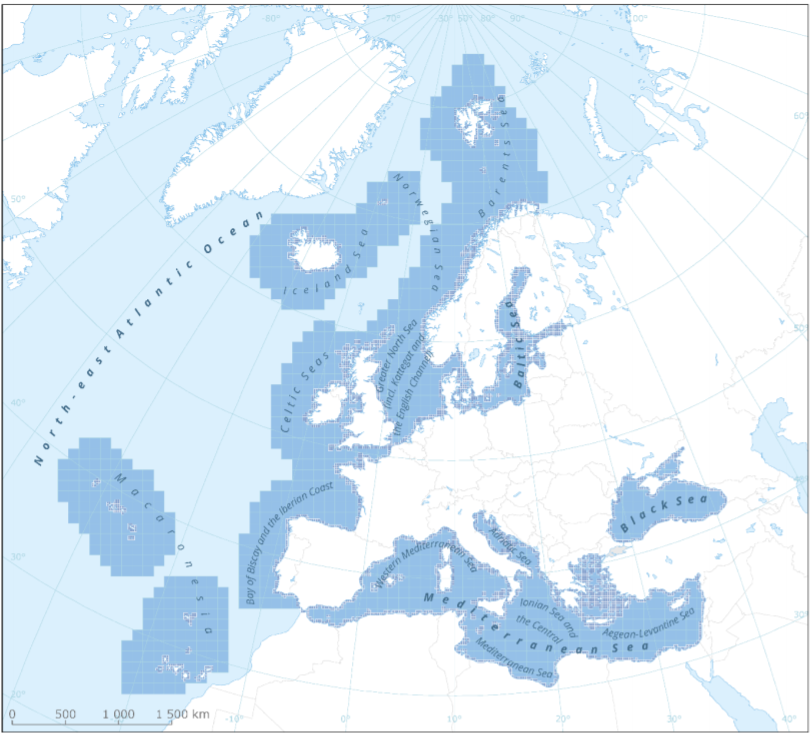
This metadata refers to the EEA marine assessment grid, to which all data and assessment results have been spatially mapped in order to ensure that data can be compared in a uniform way across the European regional seas. The marine assessment grid is based on the EEA reference grid system. The EEA reference grid is based on ERTS89 Lambert Azimuthal Equal Area projection with parameters: latitude of origin 52° N, longitude of origin 10° E, false northing 3 210 000.0 m, false easting 4 321 000.0 m. All grid cells are named with a unique identifier containing information on grid cell size and the distance from origin in meters (easting and northing). An important attribute of the EEA reference grid system is that by using an equal area projection all grid cells are having the same area for the same grid size. In this marine assessment grid, two grid sizes are used: * 100 x 100 km in offshore areas (> 20 km from the coastline) * 20 x 20 km in coastal areas (<= 20 km from the coastline) The grid sizes were choosen after an evaluation of data availability versus the need for sufficient detail in the resulting assessment. The resulting assessment grid is a combination of two grid sizes using the EEA reference grid system. The overall area of interest used in the grid is based on the marine regions and subregions under the Marine Strategy Framework Directive (MSFD). Additionally, Norwegian (Barent Sea and Norwegian Sea) and Icelandic waters (’Iceland Sea’) have been added (see Surrounding seas of Europe). Note that, within the North East Atlantic region, only the subregions within EEZ boundaries (~200 nm) have been included.
-
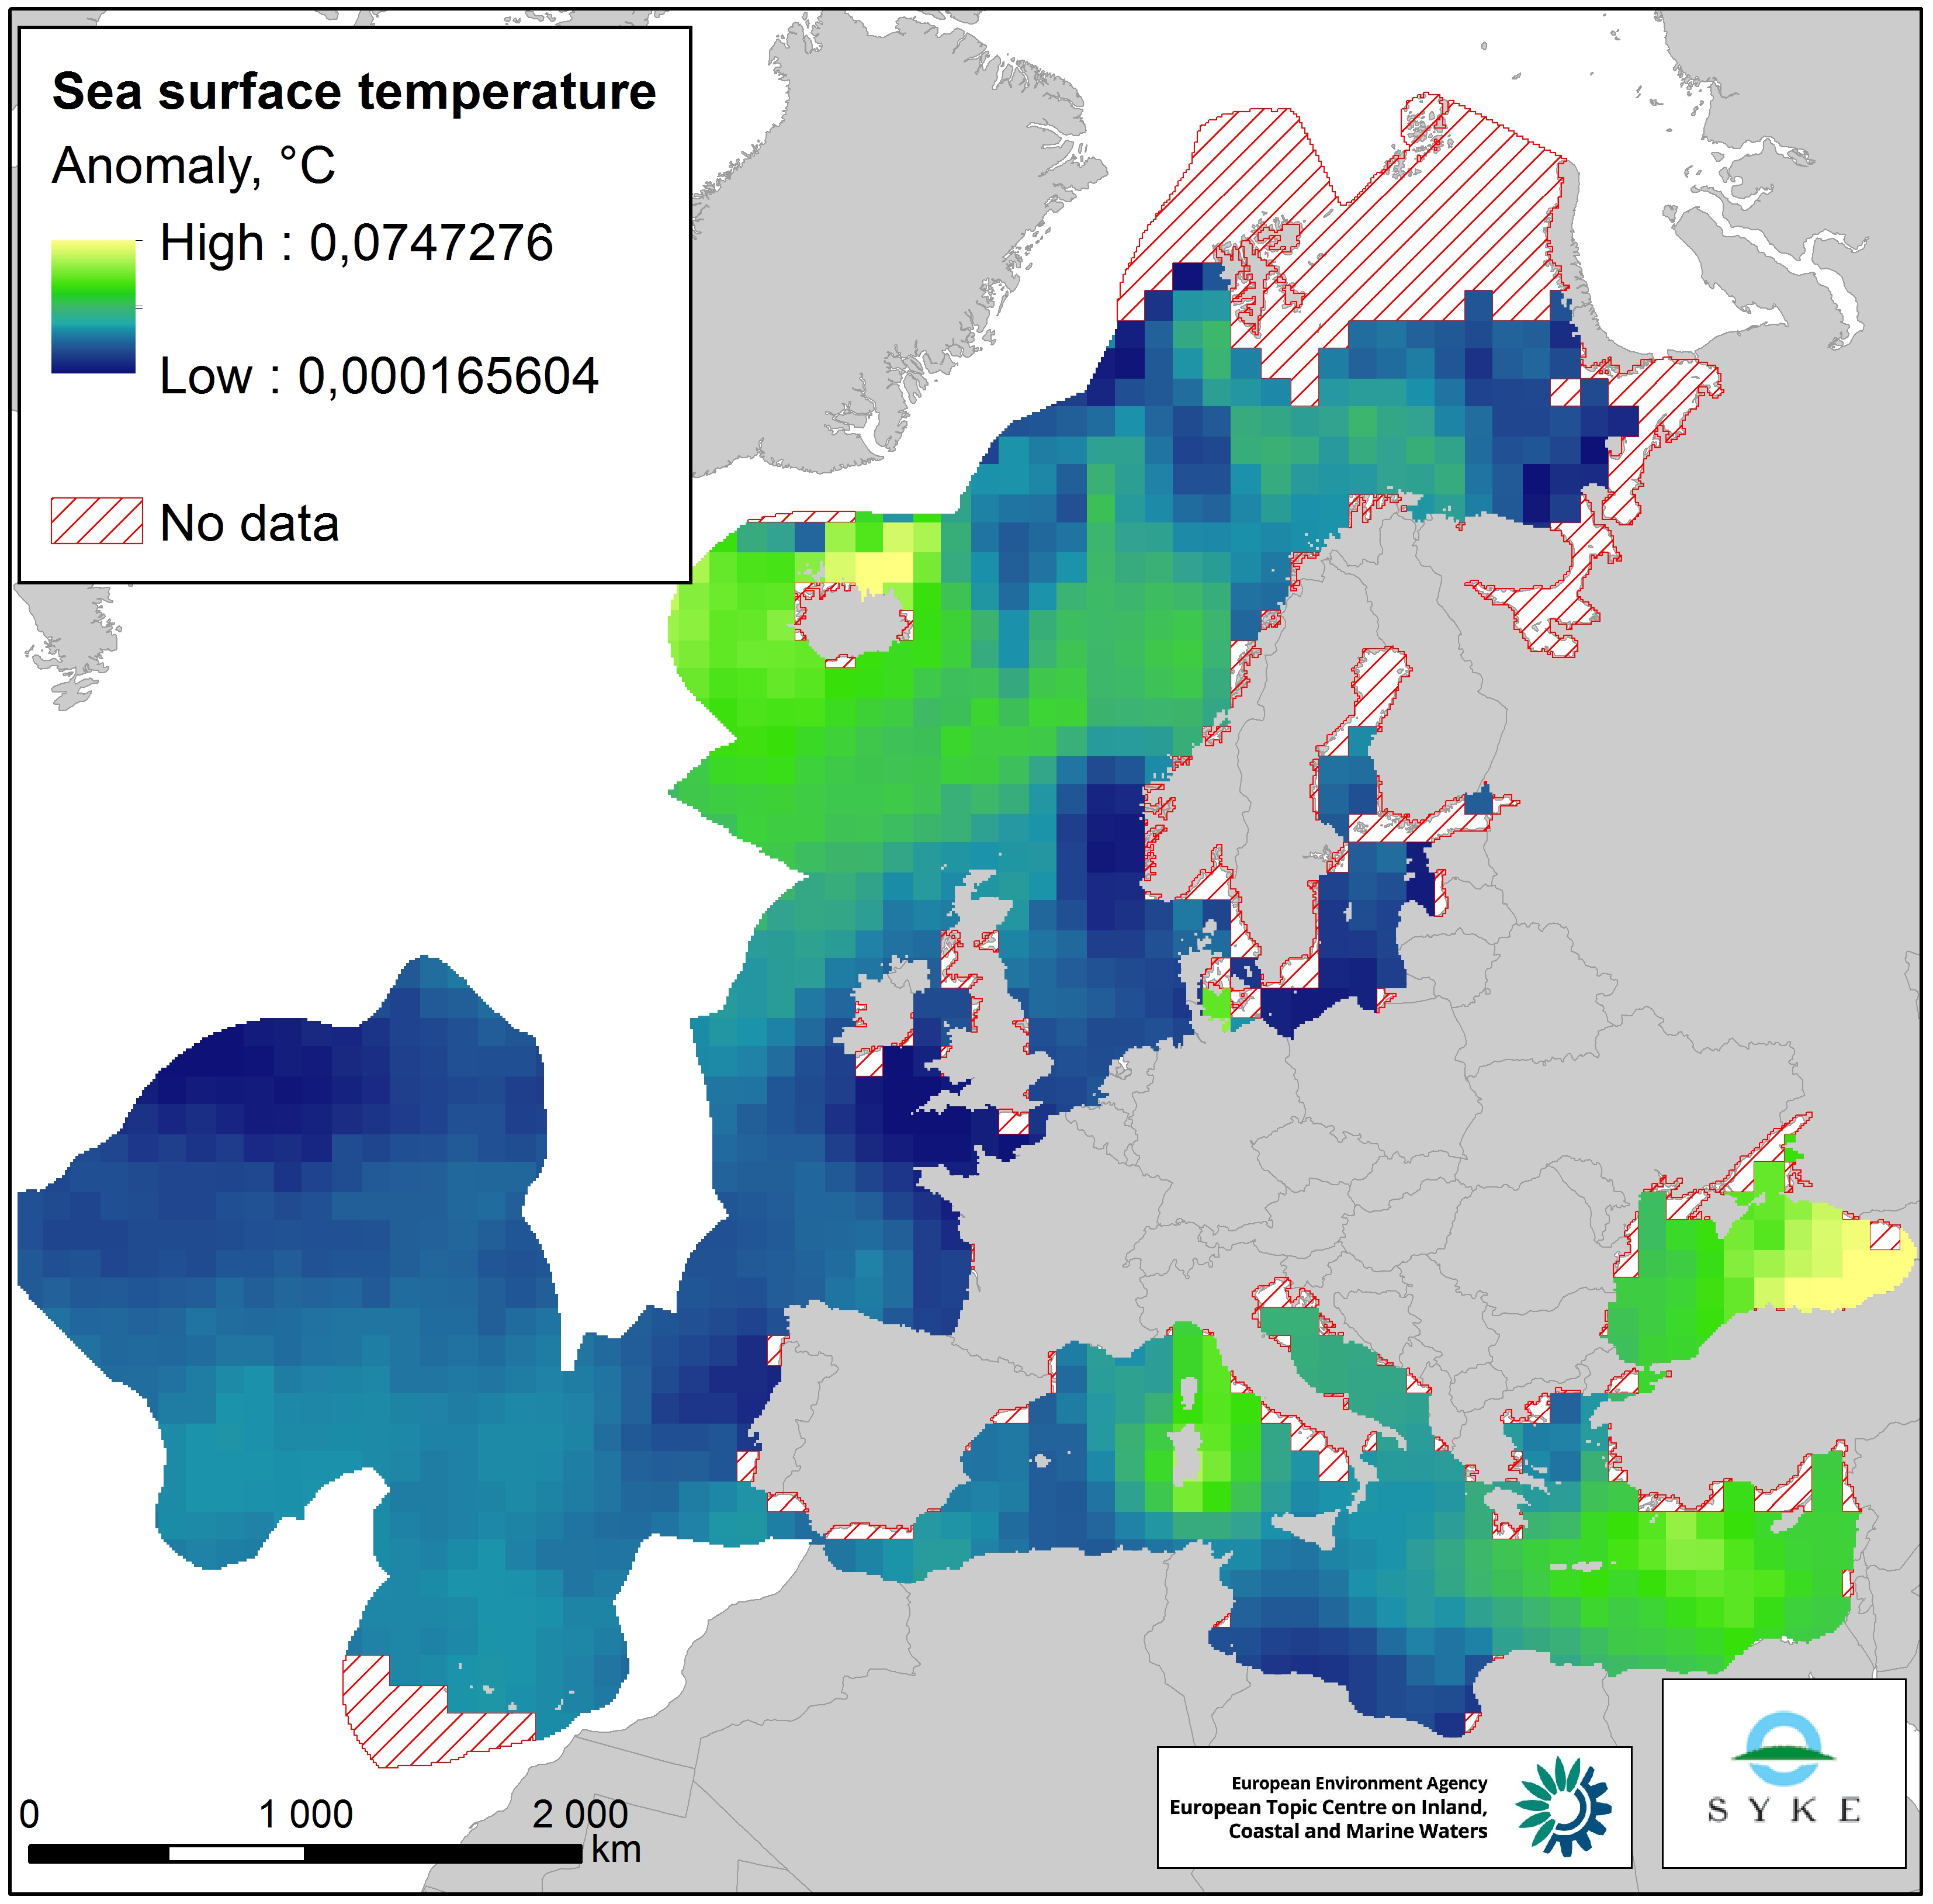
This raster dataset represents the Sea Surface Temperature (SST) anomalies, i.e. changes of sea temperatures, in the European Seas. The dataset is based on the map "Mean annual sea surface temperature trend in European seas" by Istituto Nazionale di Geofisica e Vulcanologia (INGV), which depicts the linear trend in sea surface temperature (in °C/yr) for the European seas over the past 25 years (1989-2013). Since all changes of sea temperatures can be considered to have an impact on the marine environment, the pressure layer includes absolute values of SST anomalies, i.e. negative/decreasing temperature trends were changed to positive values so that they represent a pressure. The original data was in a 1° grid format but was converted to a 100 km resolution, adapted to the EEA 10 km grid and clipped with the area of interest. This dataset has been prepared for the calculation of the combined effect index, produced for the ETC/ICM Report 4/2019 "Multiple pressures and their combined effects in Europe's seas" available on: https://www.eionet.europa.eu/etcs/etc-icm/etc-icm-report-4-2019-multiple-pressures-and-their-combined-effects-in-europes-seas-1.
-

The dataset presents the potential combined effects of sea-based pressures on marine species and habitats estimated using the method for assessment of cumulative effects, for the entire suite of pressures and a selected set of marine species groups and habitats by an index (Halpern et al. 2008). The spatial assessment of combined effects of multiple pressures informs of the risks of human activities on the marine ecosystem health. The methodology builds on the spatial layers of pressures and ecosystem components and on an estimate of ecosystem sensitivity through an expert questionnaire. The raster dataset consists of a division of the Europe's seas in 10km and 100 km grid cells, which values represents the combined effects index values for pressures caused by sea-based human activities. The relative values indicate areas where the pressures potentially affect the marine ecosystem. This dataset underpins the findings and cartographic representations published in the report "Marine Messages" (EEA, 2020).
-
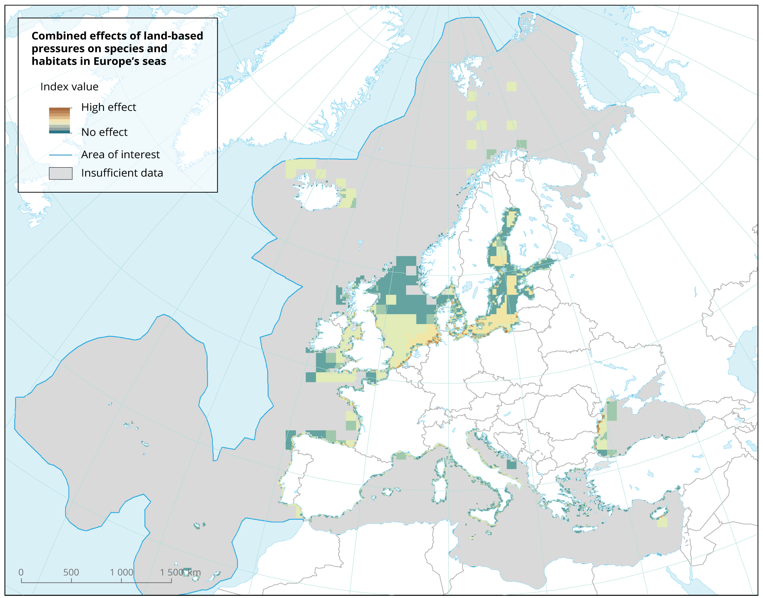
The dataset presents the potential combined effects of land-based pressures on marine species and habitats estimated using the method for assessment of cumulative effects, for the entire suite of pressures and a selected set of marine species groups and habitats by an index (Halpern et al. 2008). The spatial assessment of combined effects of multiple pressures informs of the risks of human activities on the marine ecosystem health. The methodology builds on the spatial layers of pressures and ecosystem components and on an estimate of ecosystem sensitivity through an expert questionnaire. The raster dataset consists of a division of the Europe's seas in 10km and 100 km grid cells, which values represents the combined effects index values for pressures caused by land-based human activities. The relative values indicate areas where the pressures potentially affect the marine ecosystem. This dataset underpins the findings and cartographic representations published in the report "Marine Messages" (EEA, 2020).
-
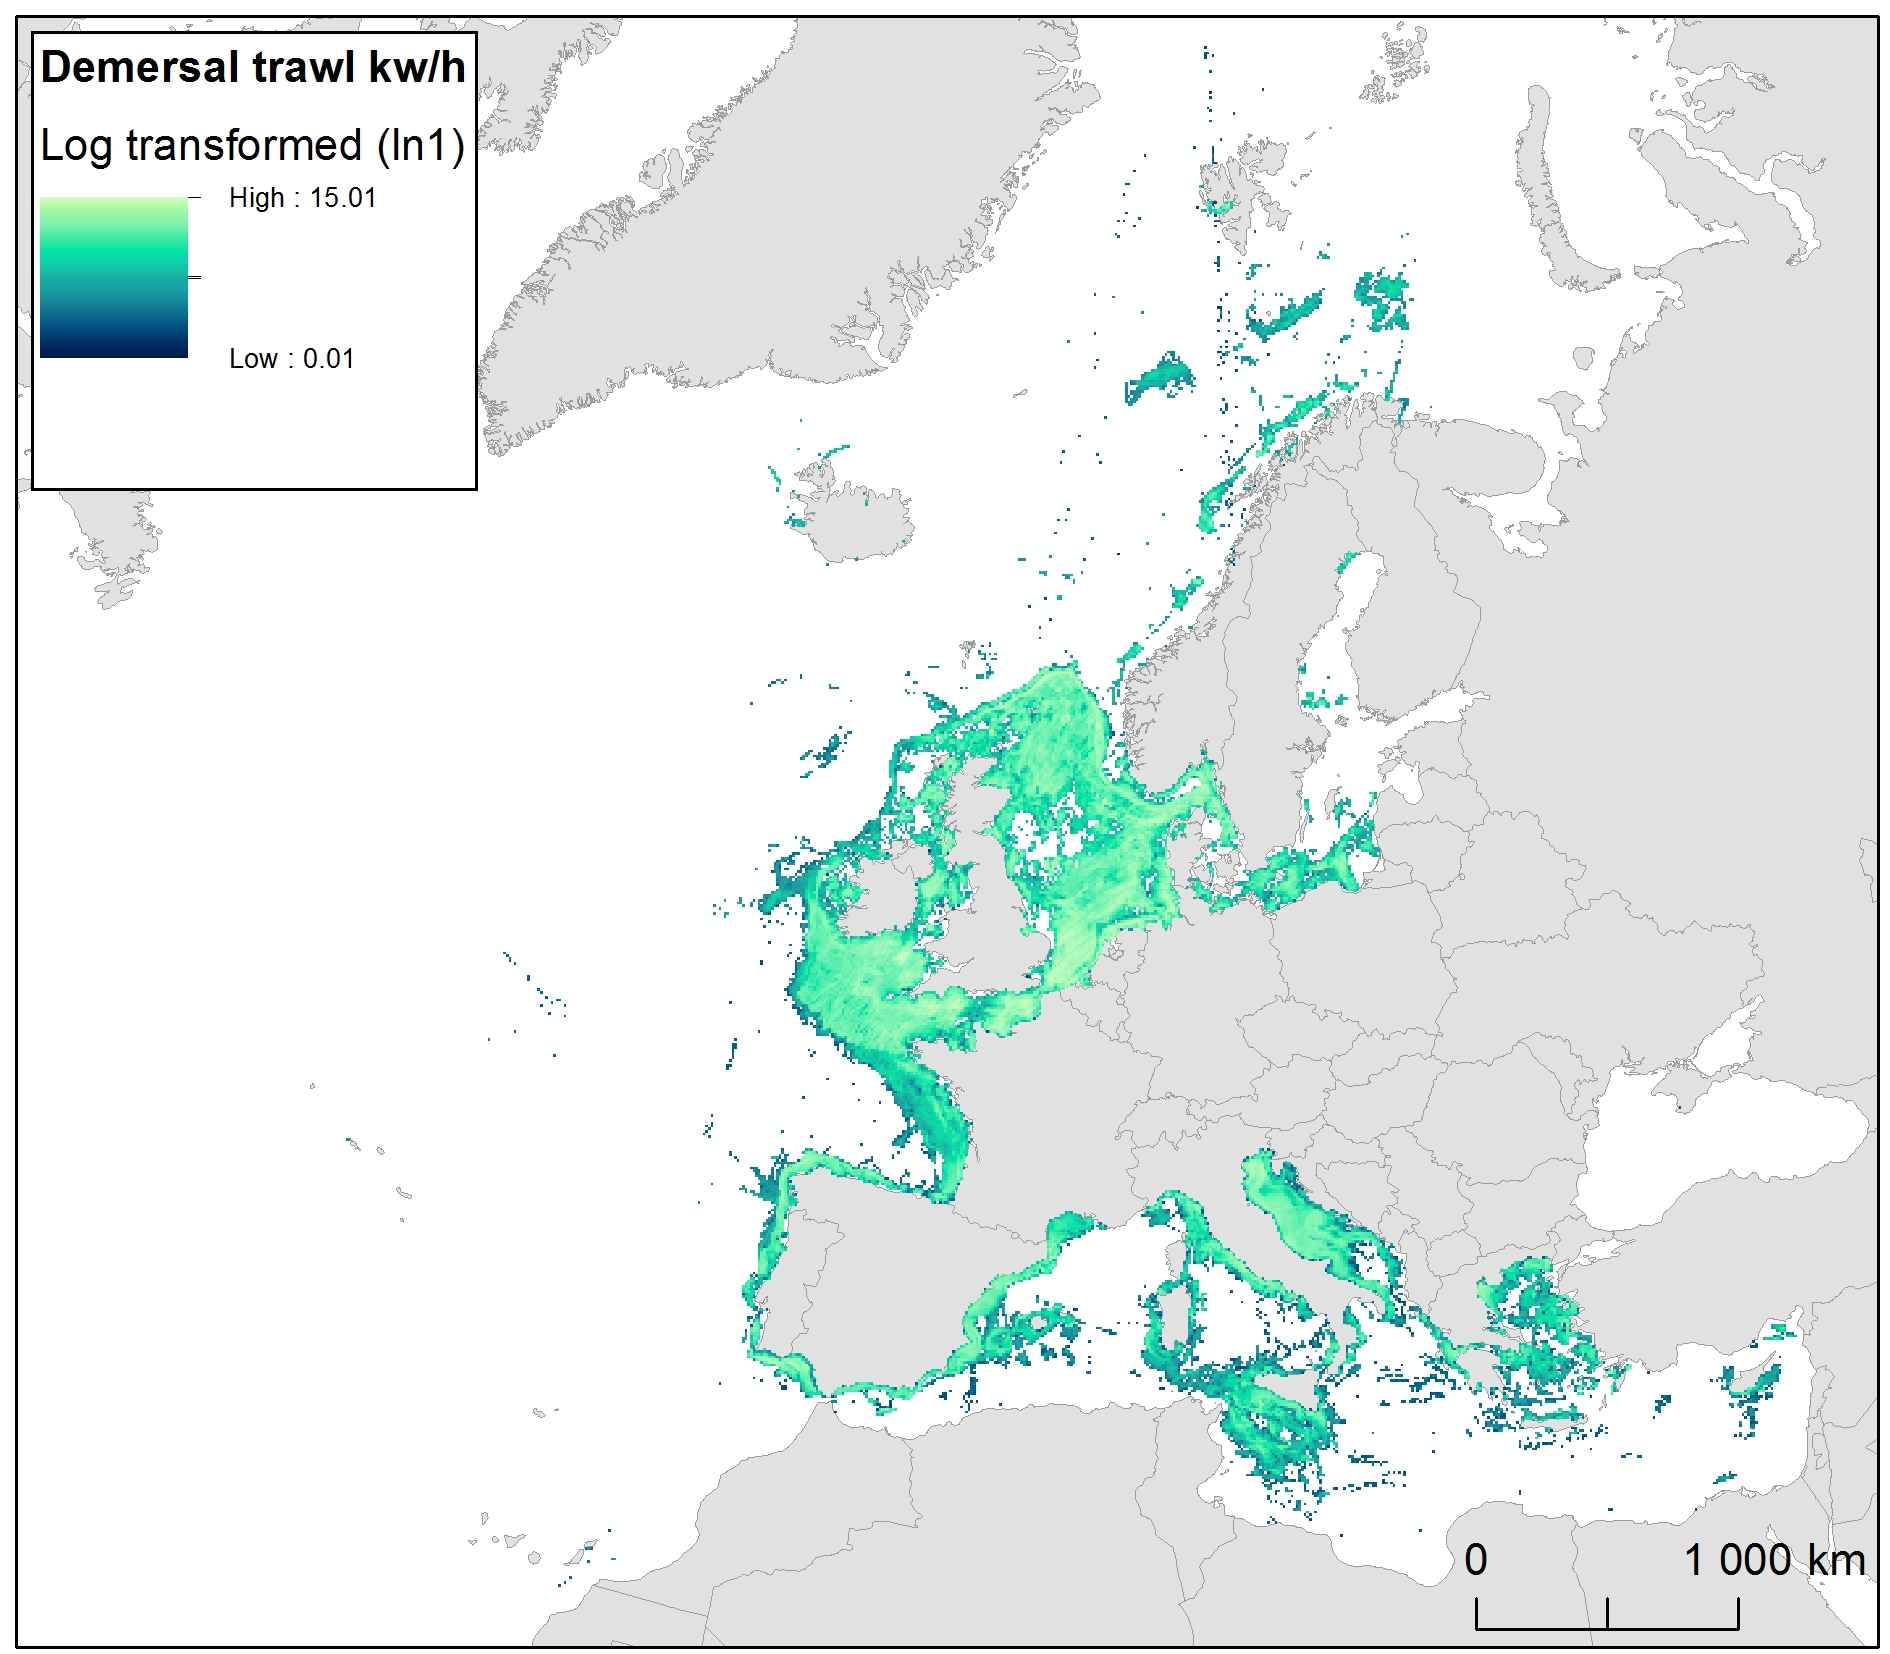
The raster dataset represents bycatch fishing intensity (kilowatt per fishing hour) from bottom touching mobile gears in the European seas. The dataset has been derived from Automatic Identification System (AIS) based demersal fishing intensity data received from the European Commission’s Joint Research Centre - Independent experts of the Scientific, Technical and Economic Committee for Fisheries (JRC STECF) as well as Vessel Monitoring System (VMS) and logbook based demersal fishing intensity data downloaded from from OSPAR and HELCOM Commissions. The temporal extent varies between the data sources (between 2014 and 2017). OSPAR and HELCOM data superseded the JRC STECF data where they overlapped spatially. The cell values have been transformed into a logarithmic scale (ln1). This dataset has been prepared for the calculation of the combined effect index, produced for the ETC/ICM Report 4/2019 "Multiple pressures and their combined effects in Europe's seas" available on: https://www.eionet.europa.eu/etcs/etc-icm/etc-icm-report-4-2019-multiple-pressures-and-their-combined-effects-in-europes-seas-1.
-
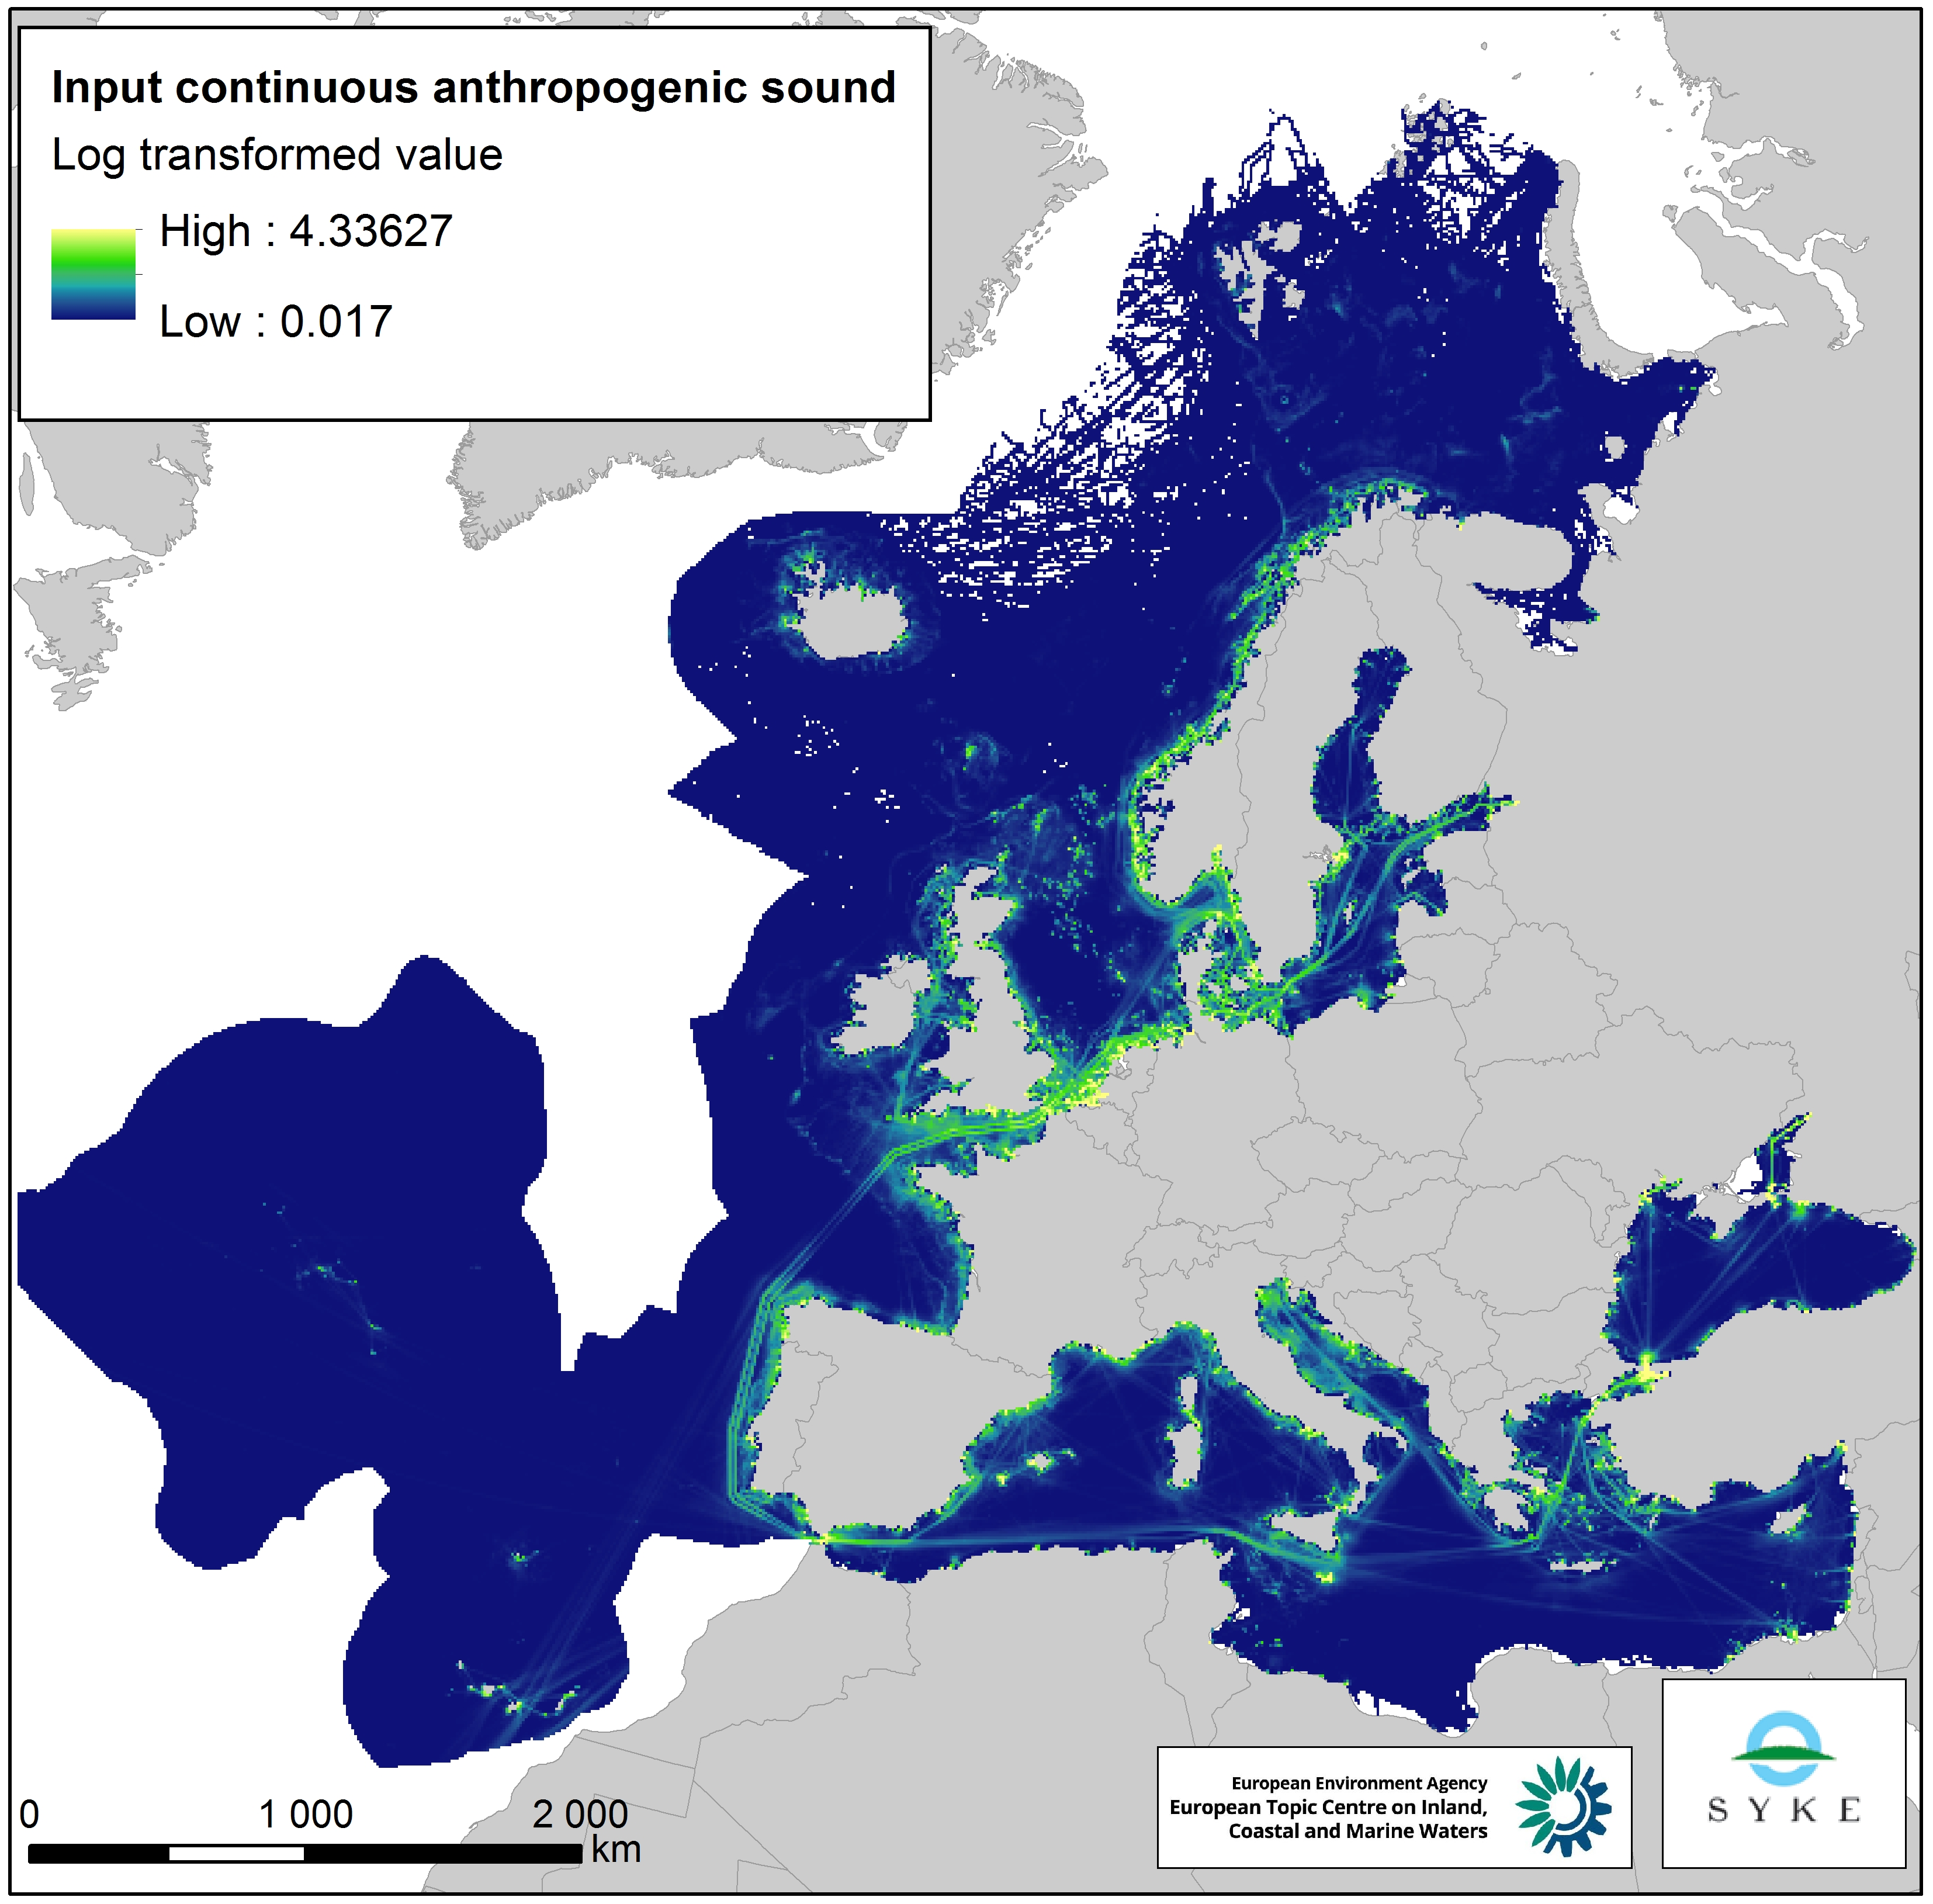
This raster dataset represents the input of continuous anthropogenic sound in the European Seas. Continuous anthropogenic underwater noise is found in the entire European marine area and is mainly produced by maritime traffic. As no thresholds for pressure have been agreed yet, even areas of low or infrequent maritime traffic are included as pressures. This dataset uses shipping density as a representation of distribution of continuous underwater noise. This dataset is based on a truncated version of the EMODnet (Automatic Identification System) AIS based vessel density dataset for 2017 (all ships, year average). The vessel density was rescaled from a 1 km to 10 km resolution (mean values) using the EEA 10 km grid. The dataset has been transformed to a logarithmic scale (ln1). This dataset has been prepared for the calculation of the combined effect index, produced for the ETC/ICM Report 4/2019 "Multiple pressures and their combined effects in Europe's seas" available on: https://www.eionet.europa.eu/etcs/etc-icm/etc-icm-report-4-2019-multiple-pressures-and-their-combined-effects-in-europes-seas-1.
-
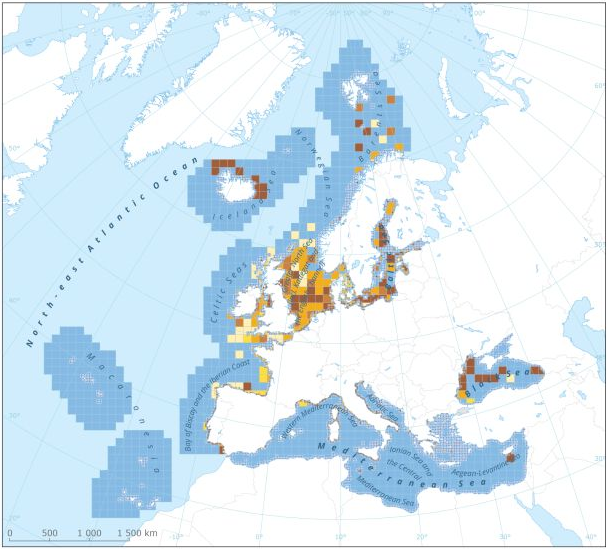
This dataset presents the resulting assessment grid (based on the EEA reference grid) with the classification of chemical status of the transitional, coastal and marine waters in the context of the Water Framework Directive (WFD) and the Marine Strategy Framework Directive (MSFD). This classification has been performed using the CHASE+ tool, with classifications of the matrices ‘water’, ‘sediment’ and ‘biota’ and indicators of ‘biological effects’, as well as an integrated classification of chemical status, combining results of all matrices. The chemical status is evaluated in five classes, where NPAhigh and NPAgood are recognised as ‘non-problem areas’ and PAmoderate, PApoor and PAbad are recognised as ‘problem areas’. This is the assessment made excluding concentrations of mercury (Hg). The overall area of interest used is based on the marine regions and subregions under the Marine Strategy Framework Directive. Additionally, Norwegian (Barent Sea and Norwegian Sea) and Icelandic waters (’Iceland Sea’) have been added (see Surrounding seas of Europe). Note that within the North East Atlantic region only the subregions within EEZ boundaries (~200 nm) have been included. This dataset underpins the findings and cartographic representations published in the report "Contaminants in Europe's Seas" (EEA, 2019).